Educational research platform for US stocks
US stock research, without the information overload.
Metravise gives every stock it tracks a 0–100 Quality Score built on 7 criteria, shares its own live portfolio with the reasoning behind every move, and sums up the market in plain English every morning. The decisions stay yours.

7 criteria → 1 Quality Score
7 criteria → 1 Quality Score
since September 2025
0–100 Quality Score
One score for every stock Metravise tracks, with all 7 criteria weighed together.
7 criteria → 1 Quality Score
Product demo
Get to know Metravise in 90 seconds
The product itself
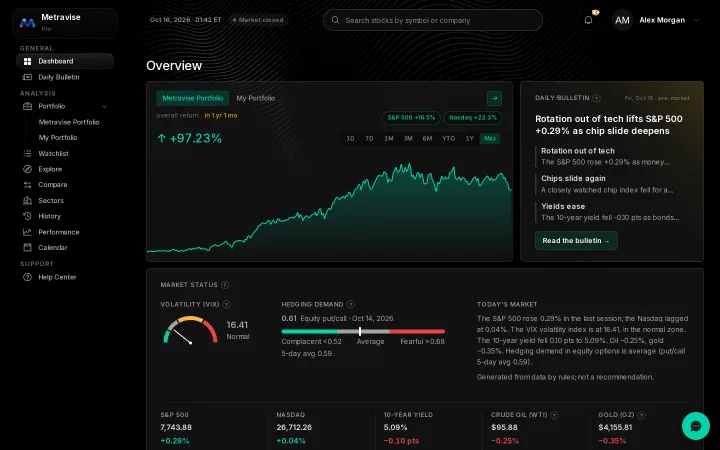
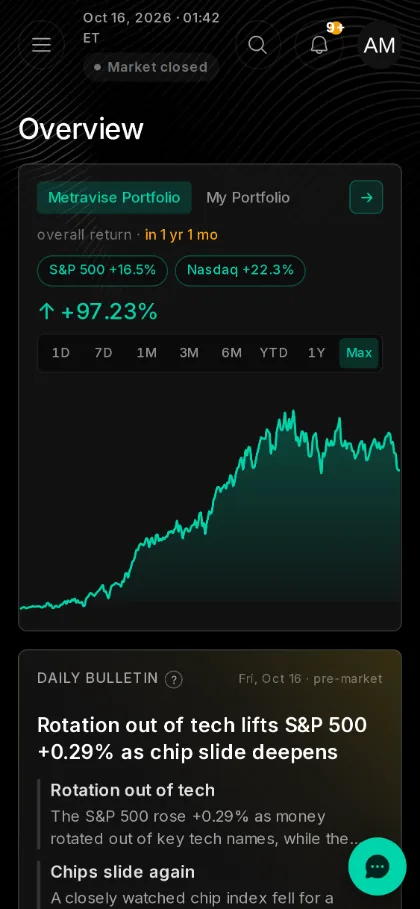
Your morning on one screen: portfolio, bulletin and market
The Dashboard brings together how the Metravise Portfolio is doing, today's bulletin and the state of the market. Just as clear on your phone as on your desktop.
How it works
Metravise in three steps
We turn scattered research into one score anyone can read and a portfolio you can follow.
 1
A selective starting point
We start from one focused list of US stocks that stand out in professional research data.
 2
A 0–100 Quality Score
We score every stock on 7 criteria fed by 17 core financial measures; the score is updated every week.
 3
A live, actively managed portfolio
Stocks that clear a set quality bar are added to the Metravise Portfolio when the timing looks technically sound. The portfolio is managed live, and every entry and exit is published with its reasoning.
Live performance
The Metravise Portfolio: real, live, every month in the open
Results of the Metravise Portfolio, tracked live since September 18, 2025 — negative months included.
- S&P 500 · same period
- +15.6%
- Nasdaq · same period
- +19.6%
- Max drawdown · peak to trough
- -25.6%
- Started
- September 18, 2025
Monthly returns
Metravise PortfolioEach bar is one month. Red bars are months that closed negative.
| Sep 2025 | +1.8% |
|---|---|
| Oct 2025 | +2.8% |
| Nov 2025 | +6.0% |
| Dec 2025 | +4.8% |
| Jan 2026 | +21.7% |
| Feb 2026 | +7.1% |
| Mar 2026 | -1.5% |
| Apr 2026 | +20.1% |
| May 2026 | +11.0% |
| Jun 2026 | +9.4% |
| Jul 2026 | -10.4% |
| Aug 2026 | -0.3% |
| Sep 2026 | +3.9% |
| Oct 2026 | -16.0% |
Figures are live and come from the same calculation as the Performance page in the app; everything is shown as a percentage. The Metravise Portfolio is Metravise's own portfolio, not a recommendation or personalized advice. Past performance is not indicative of future results.
Features
Every step of your research in one place
All 9 features of the Pro plan, included in one subscription. No add-ons.
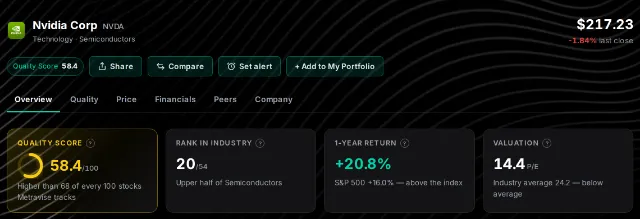
Quality Score
One 0–100 score per stock with all 7 criteria weighed together, so its strengths and weak spots show at a glance.
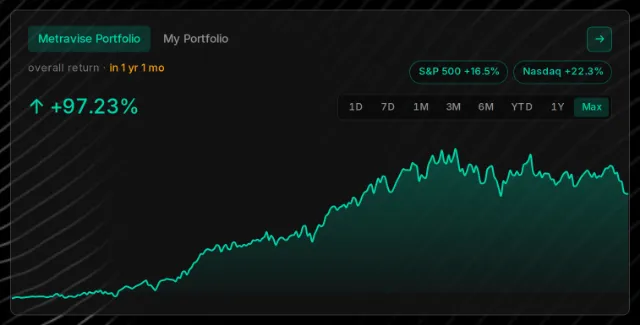
Metravise Portfolio
Metravise's own live portfolio: every entry and exit is shared openly, with its reasoning and its return.
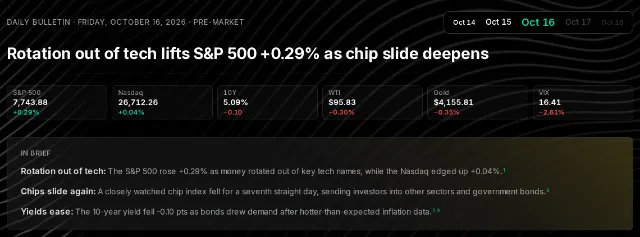
Daily Bulletin
Every trading day before the open: what's moving the market, sourced and in plain English.
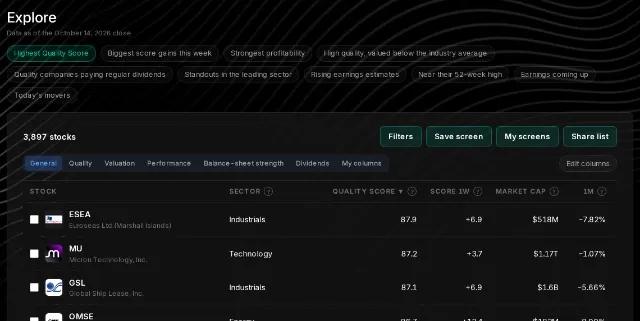
Explore
List stocks by score, sector and valuation with ready-made screens and filters, and save your own screens.
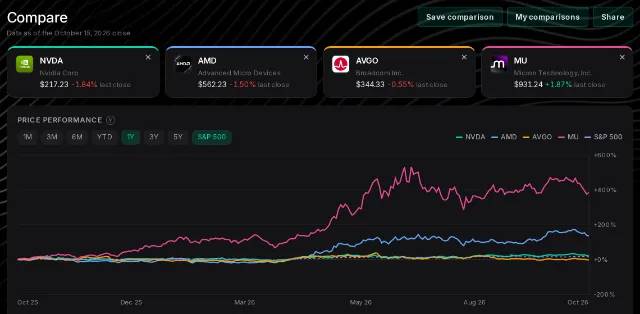
Compare
Put four stocks side by side, with price performance and key figures on one screen.
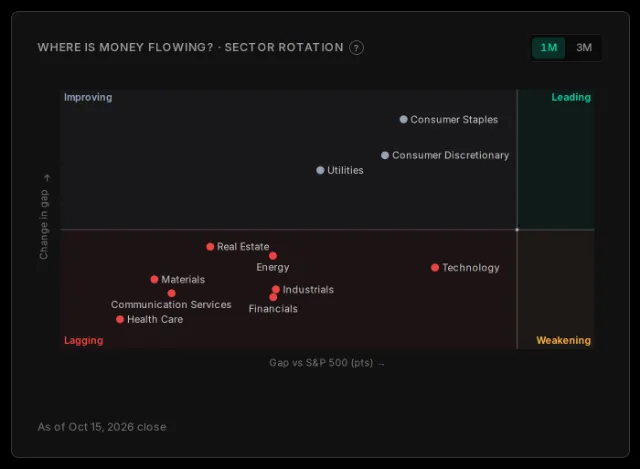
Sectors and money flow
See on a map which sectors money is flowing into and which are running ahead of the index.
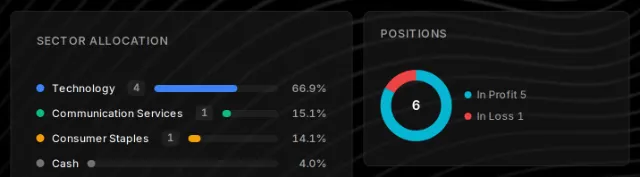
My Portfolio
Enter your own trades and see your return, sector mix and index comparison calculated for you.
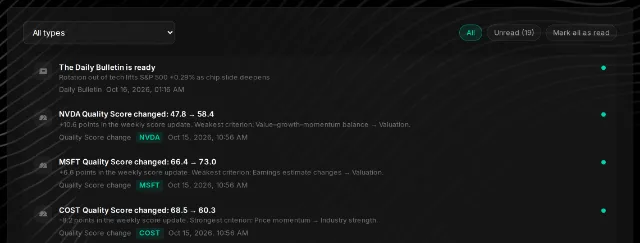
Personal notifications and price alerts
Set price, daily-move and Quality Score alerts, and get updates on the stocks you follow.
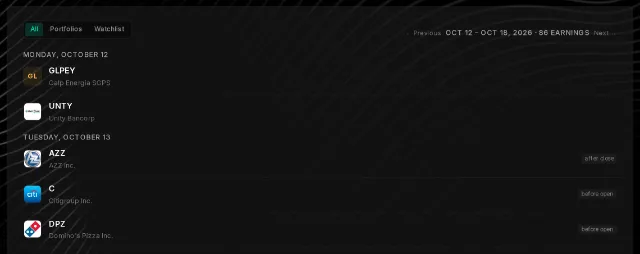
Calendar
Follow earnings dates for the stocks Metravise tracks in a weekly view.
Pricing
One plan, everything included
Try it free for 14 days, then decide whether to continue.
Billed yearly · US dollars · Excl. tax
Billed monthly · US dollars · Excl. tax
No card needed · cancel in one click
Included in Pro
- Quality Score and 7 criteria for every stock Metravise tracks
- Metravise Portfolio with the rationale for every entry and exit
- Daily Bulletin
- Explore and saved screens
- Compare
- Sectors and money flow
- My Portfolio
- Personal notifications and price alerts
- Calendar
No surprises
- No card needed to start the trial, and nothing is charged automatically when it ends.
- Cancel from inside your account in one click; access lasts until the end of the period you paid for.
- Full refund, no questions asked, within 14 days of your first payment.
- Monthly or yearly: switch plans any time under Settings.
- The Daily Bulletin email keeps coming even after the trial ends.
- One plan: no locked features, upper tiers or extra fees.
- No ads or sponsored content; we take no money from any company.
- You choose which notifications you get, type by type.
Frequently asked questions
The questions new investors ask us most.
What is Metravise — and what isn't it?
Metravise is an educational research platform for looking at US stocks clearly and transparently. It gives every stock it tracks a Quality Score from 0 to 100, shows its own portfolio in the open with the reasoning behind each move, and publishes a bulletin every trading day. It isn't an investment adviser or a broker, and it doesn't give trading recommendations, trade plans or personal advice. Your decisions are your own.
Read in the Help CenterI don't know much about investing. Can I still use Metravise?
Yes. Metravise is written with beginners in mind: every screen uses plain language, the “?” marks next to cards open short explanations, and a quick tour greets you on your first visit. Anything you get stuck on is explained step by step in the Help Center.
Read in the Help CenterHow much time do I need each day?
A few minutes is enough. Reading the Daily Bulletin and glancing at the Dashboard each trading morning gives you the market in summary. The price and score alerts you set, and news on the stocks you follow, come to you as notifications, so you don't have to watch the screen.
How do I invest in US stocks? Do I need a broker?
To invest in US stocks you need an account with a broker that offers access to US exchanges. Metravise is not a broker: it doesn't take money or orders, and it doesn't trade. It handles the research side and works alongside whichever broker you use.
How is it different from free tools?
Free tools mostly give you raw data and price charts, and leave it to you to work out what matters. Metravise boils each stock down to one 0–100 score built on 7 criteria, shares its own portfolio live with the reasoning behind every entry and exit, and sums up the market in plain English every morning. There are no ads and no sponsored content.
What is the Quality Score based on?
The Quality Score is built on 7 criteria fed by 17 core financial measures. The criteria are profitability, balance sheet, value–growth–momentum balance, earnings estimate changes, valuation, industry strength and price momentum. No single criterion decides the score. It is recalculated once a week with the latest data. The score is a measure of a company's quality, not a recommendation.
Read in the Help CenterIs the Metravise Portfolio real, and how can I follow it?
Yes. The Metravise Portfolio is Metravise's own live portfolio, tracked since September 18, 2025. Which stocks came in and went out, when, how it has performed and why each move was made are all shown in the app, and changes also reach you as notifications. Everything is shown as a percentage. The portfolio is not a recommendation; it's there so you can study how it's built.
Read in the Help CenterHow does the trial work, and when am I charged?
Your 14-day free trial starts when you sign up. Every Pro feature is open and no card is needed. Nothing is charged automatically when the trial ends; if you want to continue, you choose the monthly or yearly Pro plan on the checkout page. The Daily Bulletin email keeps coming after the trial ends.
Read in the Help CenterHow do cancellations and refunds work?
You can cancel from Settings in one click. You keep access until the end of the period you paid for and won't be charged again. You can get a full refund within 14 days of your first payment, on the monthly or the yearly plan.
Read in the Help CenterMonthly or yearly — what's the difference?
Both plans include everything in Pro. The yearly plan costs less than paying monthly; the saving is shown on the checkout screen. You can switch under Settings → Billing & Payment: monthly to yearly happens right away (the unused part of the month is credited), yearly to monthly when your yearly period ends.
Read in the Help CenterHow is payment taken? Can I get an invoice?
Payment and billing are handled by Stripe (Link) as the merchant of record; the Metravise service is provided by Monolitics OÜ, registered in Estonia. An invoice for every payment can be downloaded from your account. It appears on your card statement as LINK.COM* METRAVISE.
Read in the Help CenterDoes the price include tax?
No, the list price excludes tax. If your country taxes digital services (for example VAT), you'll see the amount on the checkout screen before you pay, and the tax is shown on your invoice. Prices are in US dollars; you can also pay in your local currency at checkout, and the currency conversion is shown on the checkout screen.
Read in the Help CenterIs Metravise available in English and Turkish?
Yes. The app, the Daily Bulletin, emails and the Help Center are all available in English and Turkish. You can switch languages anytime from the user menu in the top-right corner.
Read in the Help CenterHow up to date is the data?
Live prices update every minute during the session and are delayed by 15 minutes. Pages such as Explore, Compare and Sectors are based on the previous close and refreshed every night; each page shows which close it uses. The Quality Score is recalculated once a week.
Read in the Help CenterYou make the decisions. Metravise makes the research easier.
No card needed · cancel in one click
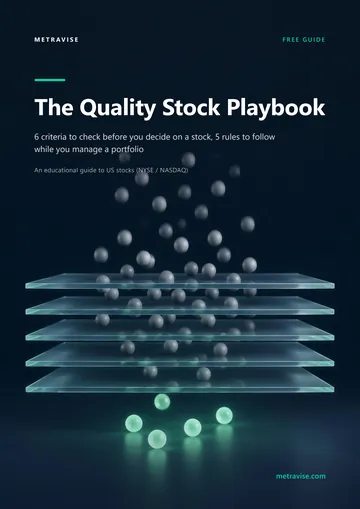
Free guide
The Quality Stock Guide
A short, plain-English, printable starter guide for people new to the US stock market. Leave your email and it lands in your inbox.
What you'll learn
- 1The 3 mistakes individual investors make most often, and how to avoid them
- 26 criteria to check before deciding on a stock, with a printable checklist
- 35 rules for running a portfolio without letting emotions decide
PDF · 17 pages · English · free